Ever had an unstructured data that you couldn’t understand?
As we know that unstructured and unclear data is of less help to any business. Therefore data needs to be in simpler and understandable form. That's why we make it very simple in our vehicle management software to view the complete fleet performance with an easy and understandable dashboard, graphs, downloadable reports, and real time alerts to keep you informed at every moment. We at fleetx give you something better than just data, we give you clarity with relevant data.
A SIMPLER VIEW TO SEE PERFORMANCE
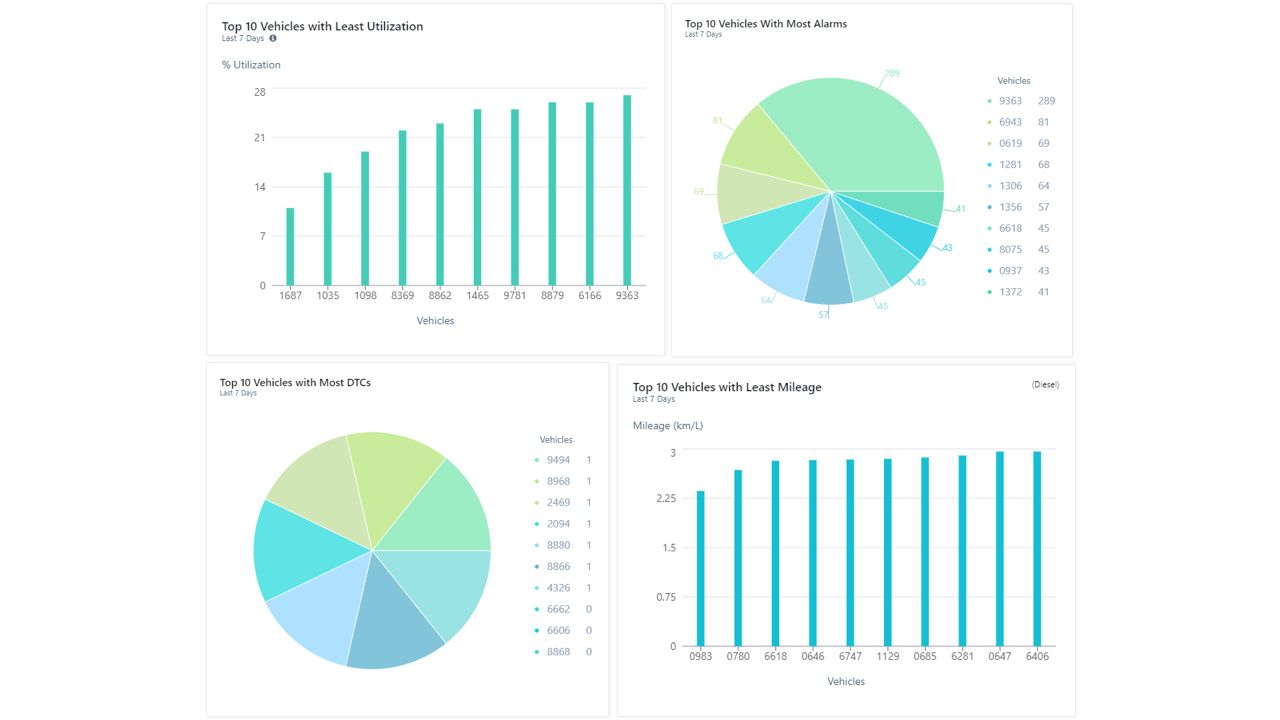
The most simple way to view a vehicle performance is Dashboard with Graphs. It gives you both the big picture and the complete details in a single view. The graph displays a snapshot of the trends that gives you a complete picture and a few clicks on it takes you deeper with complete data that shows how your drivers are operating and how your vehicle performance is. Take a look at our various performance graphs below.
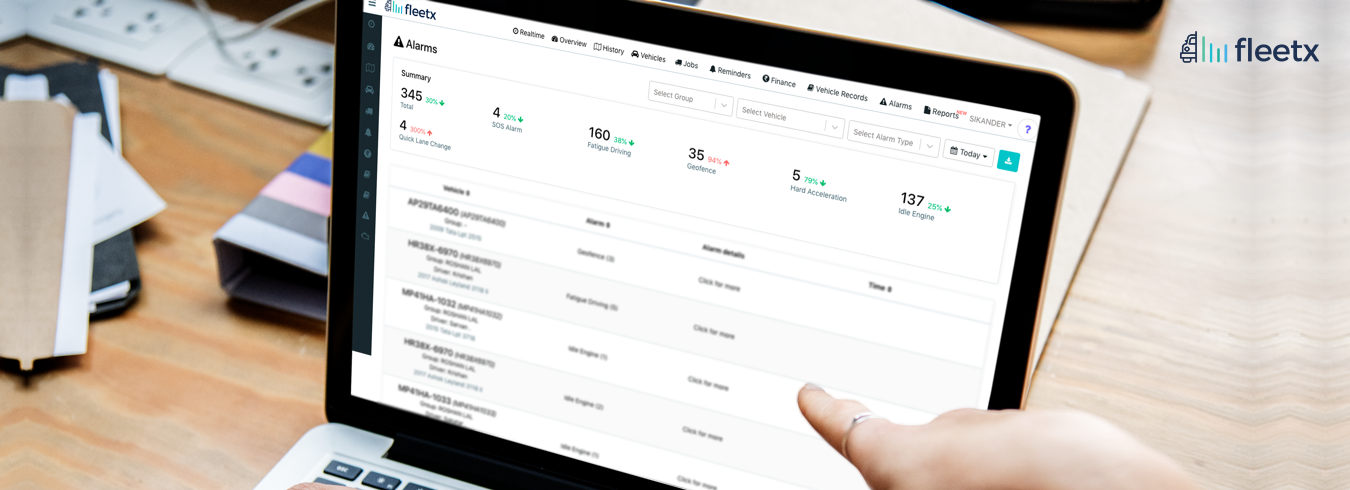
Real-time Alerts and its dashboard
With real-time alerts you would never miss critical events, it keeps you updated at every point of time on any crucial fleet activities. Alerts are designed to take quick and effective decisions based on the vehicle's activities. Alerts can be automatically be informed to you in the form of SMS/email or push notification. Some of our standard alerts include:
- Speed Alerts
- Geofence Alerts
- Fuel Level Alerts
- Temperature Alerts
- Idle Engine Alerts
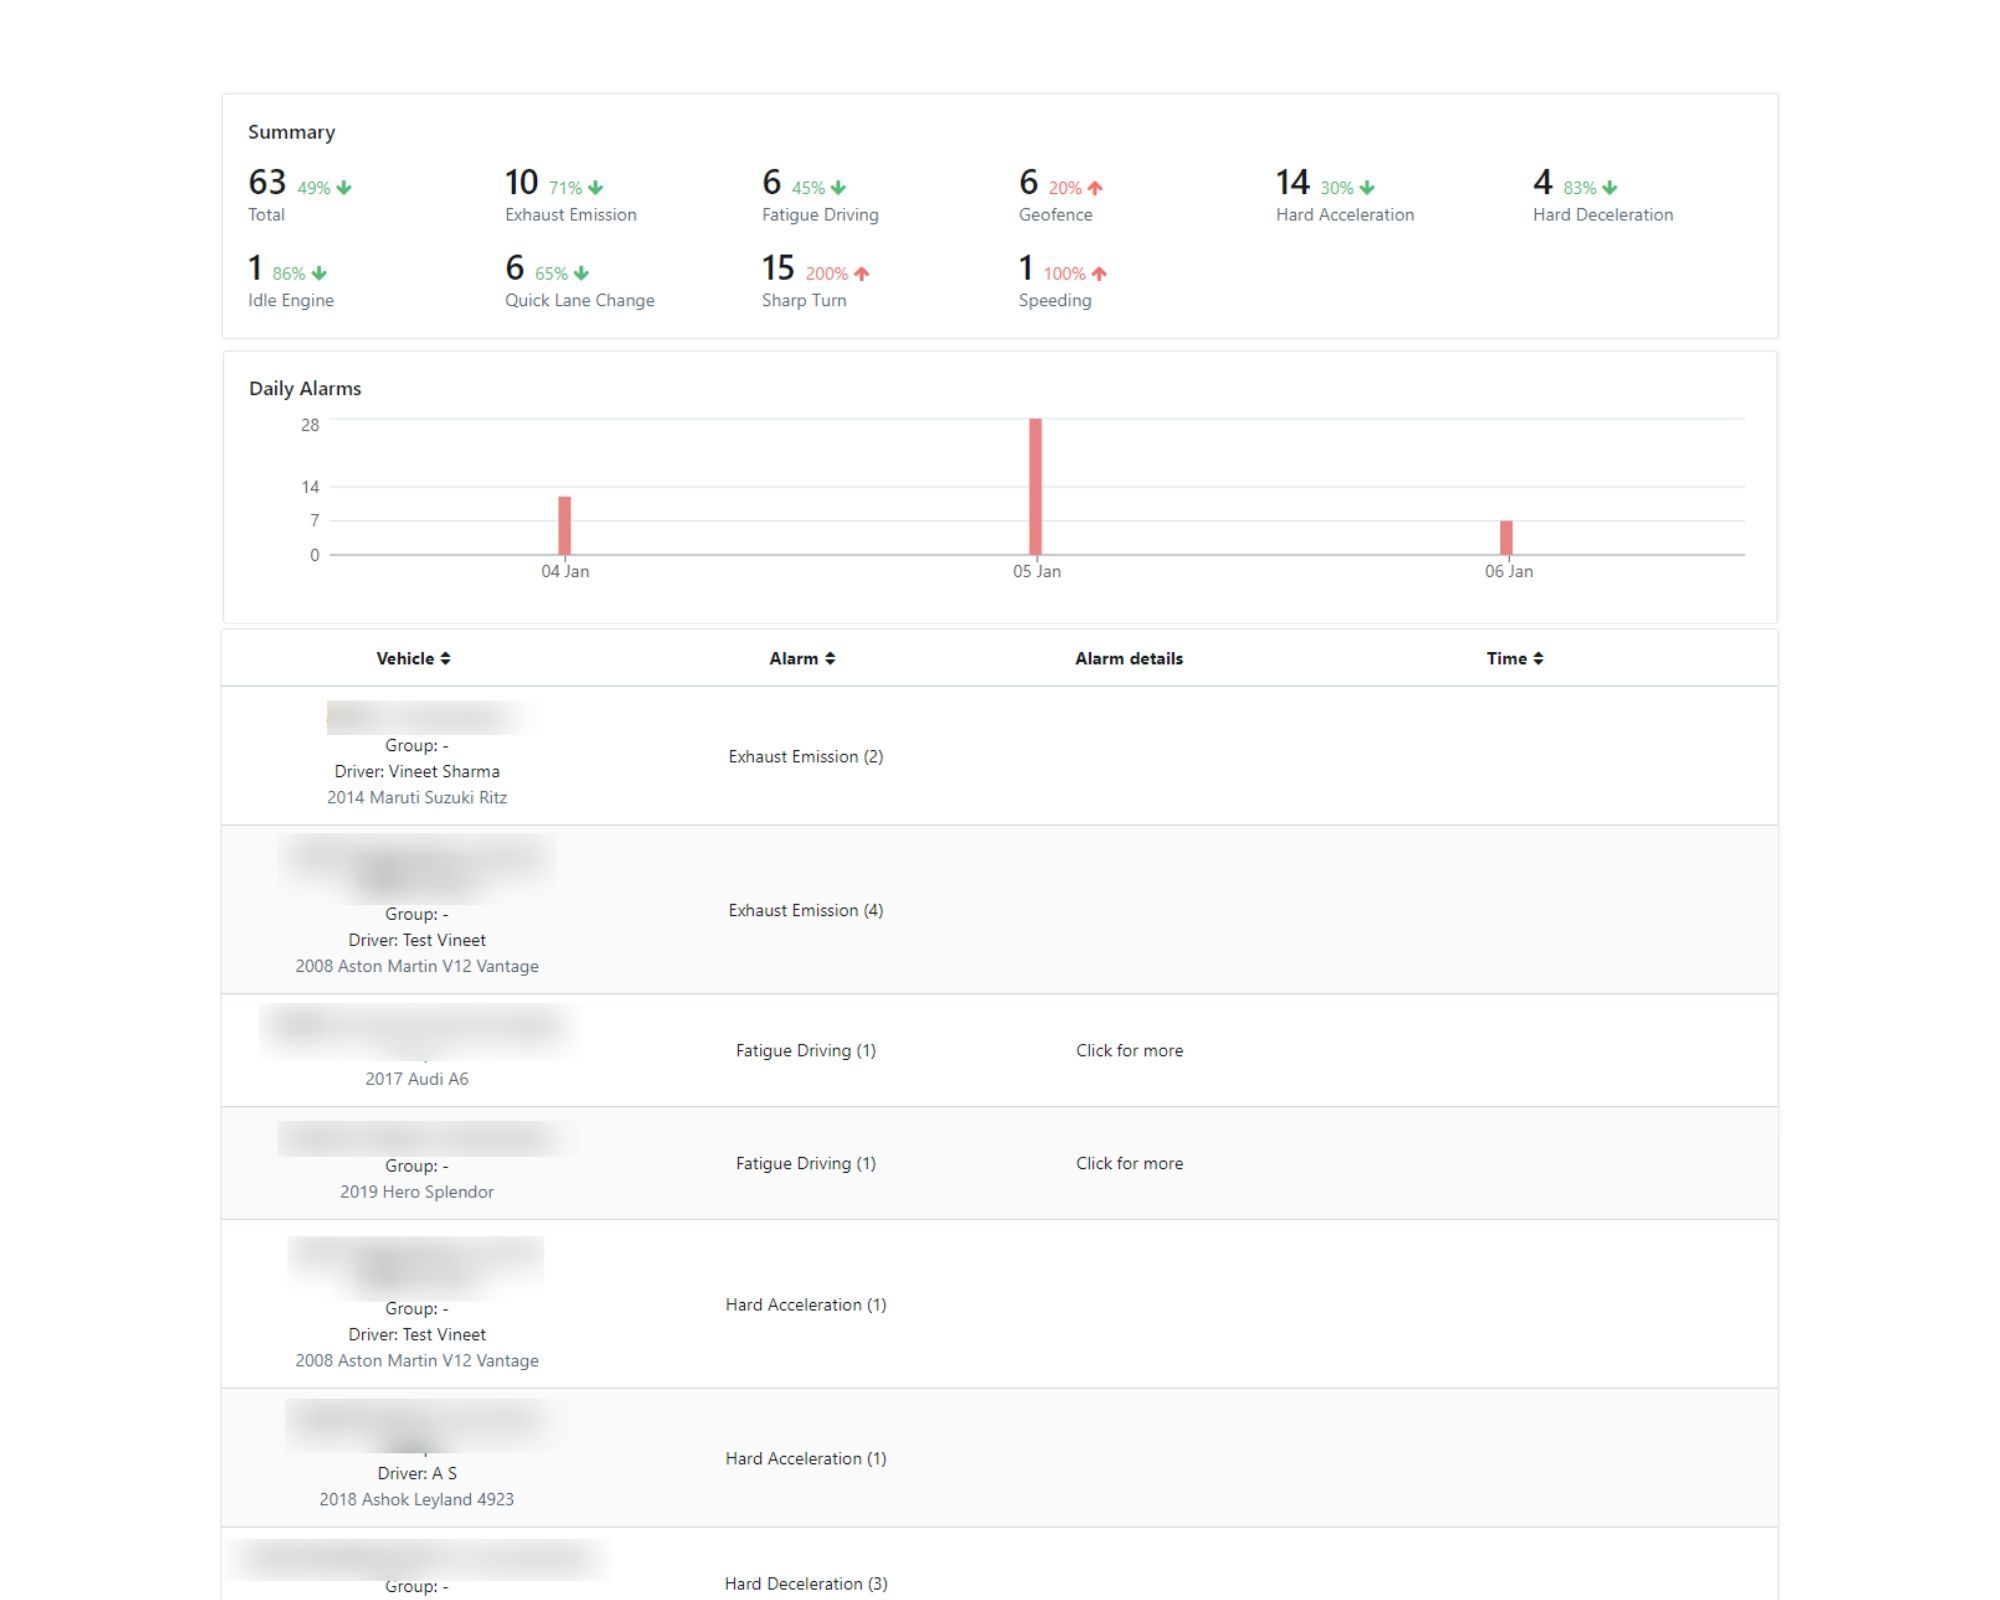
The biggest chunk of ROI from fleet management software comes from alerts. Get instant alerts and continuously monitor your fleet to improve their productivity. Our combined alert summary, dashboard, and graph are shown below.
Easy to understand and download Reports
Find out what your vehicles were doing at any date, time, and location. Reports track all the vital data points of your fleet at every point of time. Some of the crucial data points are:
- Ignition On & Off
- Trip Start & Stop Time/Location
- Idling Vehicle Time
- Geofence Entries and Exits
- Hard Accelerations and sharp turns
These data points are very essential to view the performance architect of any fleet at any point of time. Also, with customized fleet and vehicle reports, Fleetx helps you identify operational issues, uncover inefficiencies, and improve driver safety. Reports are easily viewed online or exported to several other different formats. With report data, you can easily identify hidden patterns, trends and set goals around key metrics. Some of our standard Report includes:
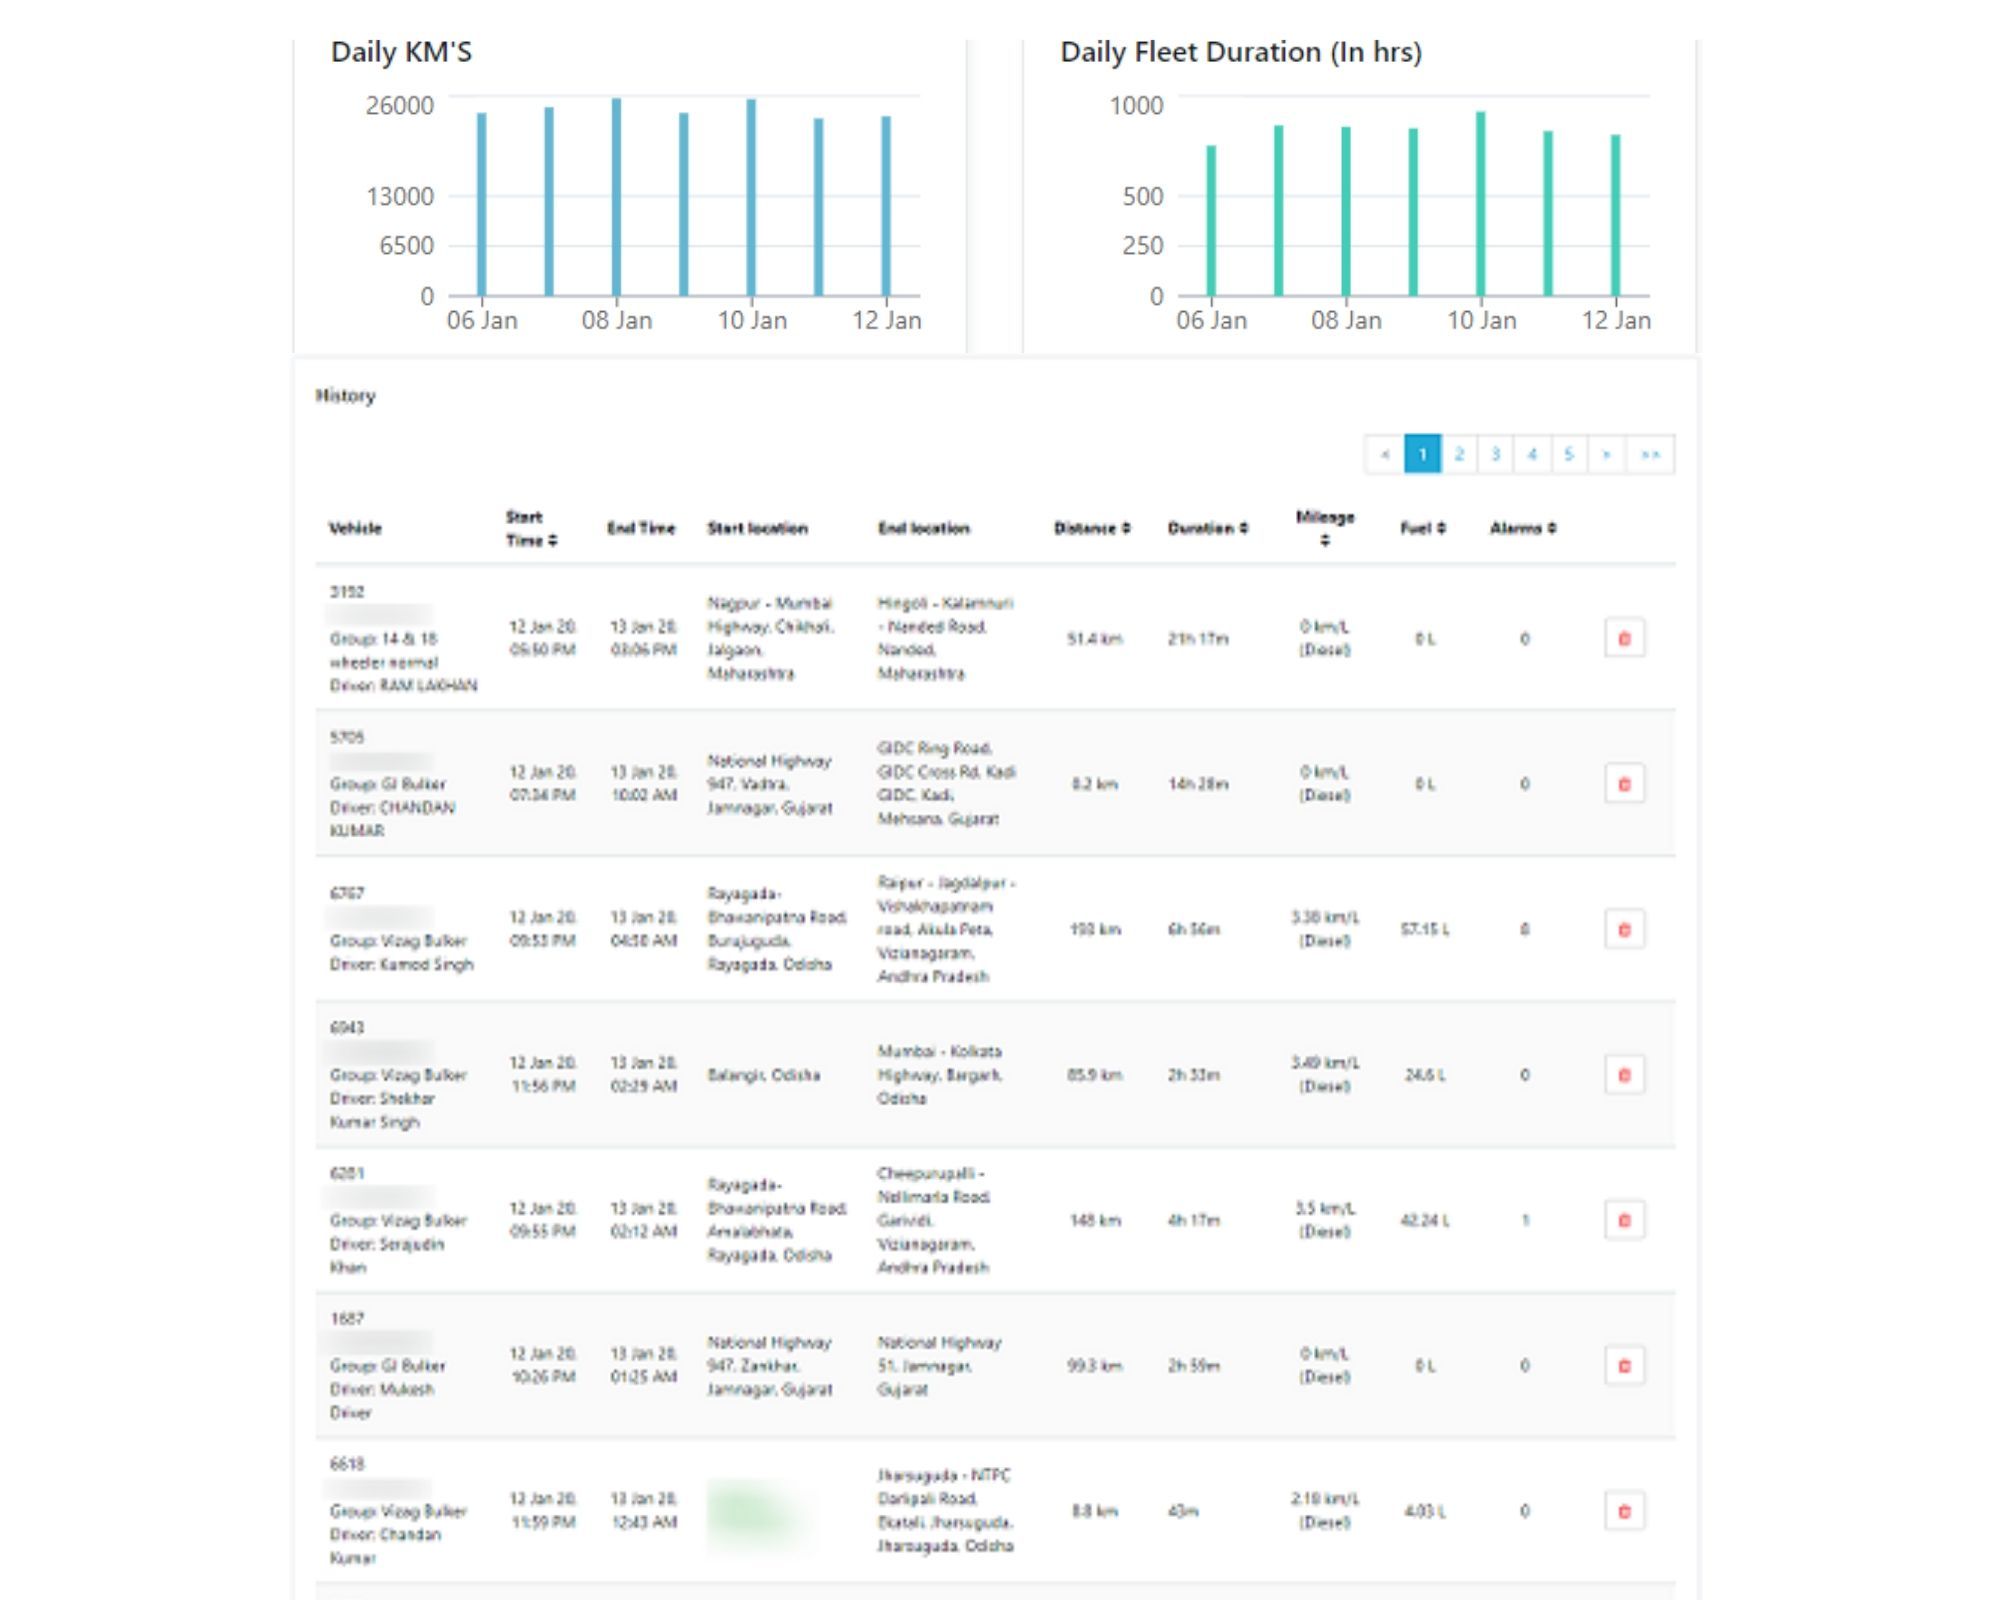
- Fleet Running Report
Fleetx offers an easy way to see a fleet’s total running km, total running duration and fleet’s total mileage for any duration. Whether you need to view daily running, or historical location, fleetx offers you data at every point of time. Get a quick and clear overview of when, how long and how often your vehicles are running and see how efficient your vehicles are when out on the road.
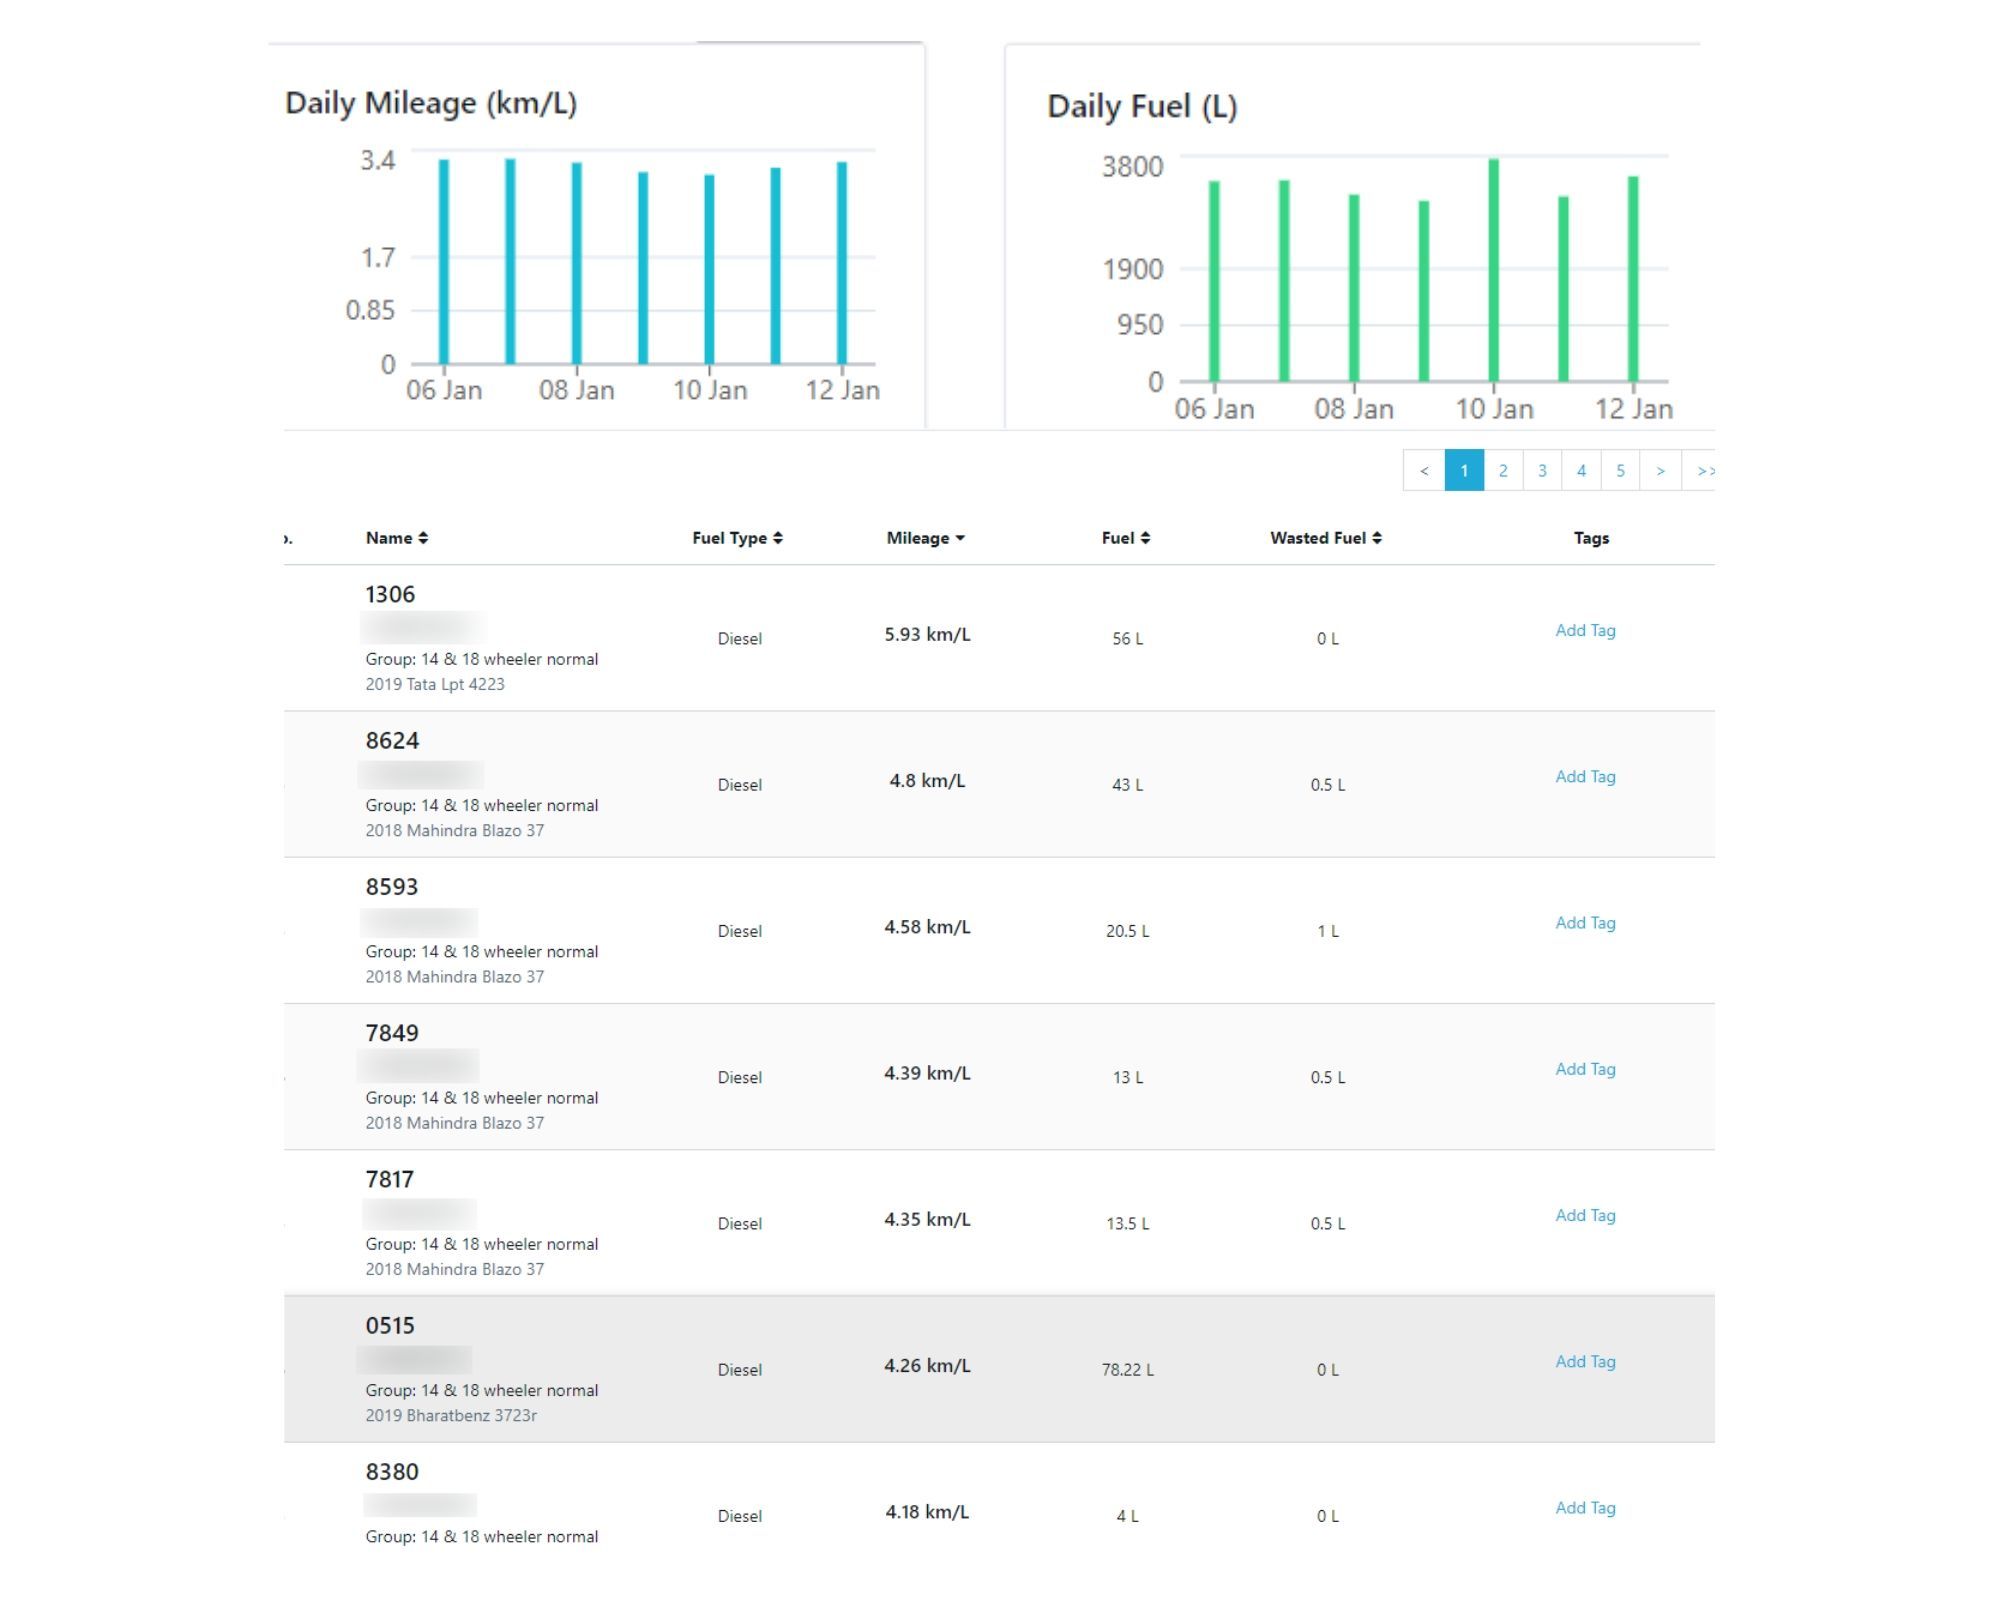
- Fuel Consumption Report
Reducing how much fuel your fleet burns can help you save money. A GPS fleet vehicle tracking solution can allow you to see the approximate amount of fuel used by each vehicle in liters or in rs. By visualizing the daily usage data of fuel consumption, you can take actions to drive down fuel usage, such as vehicle idling, over speeding instances.
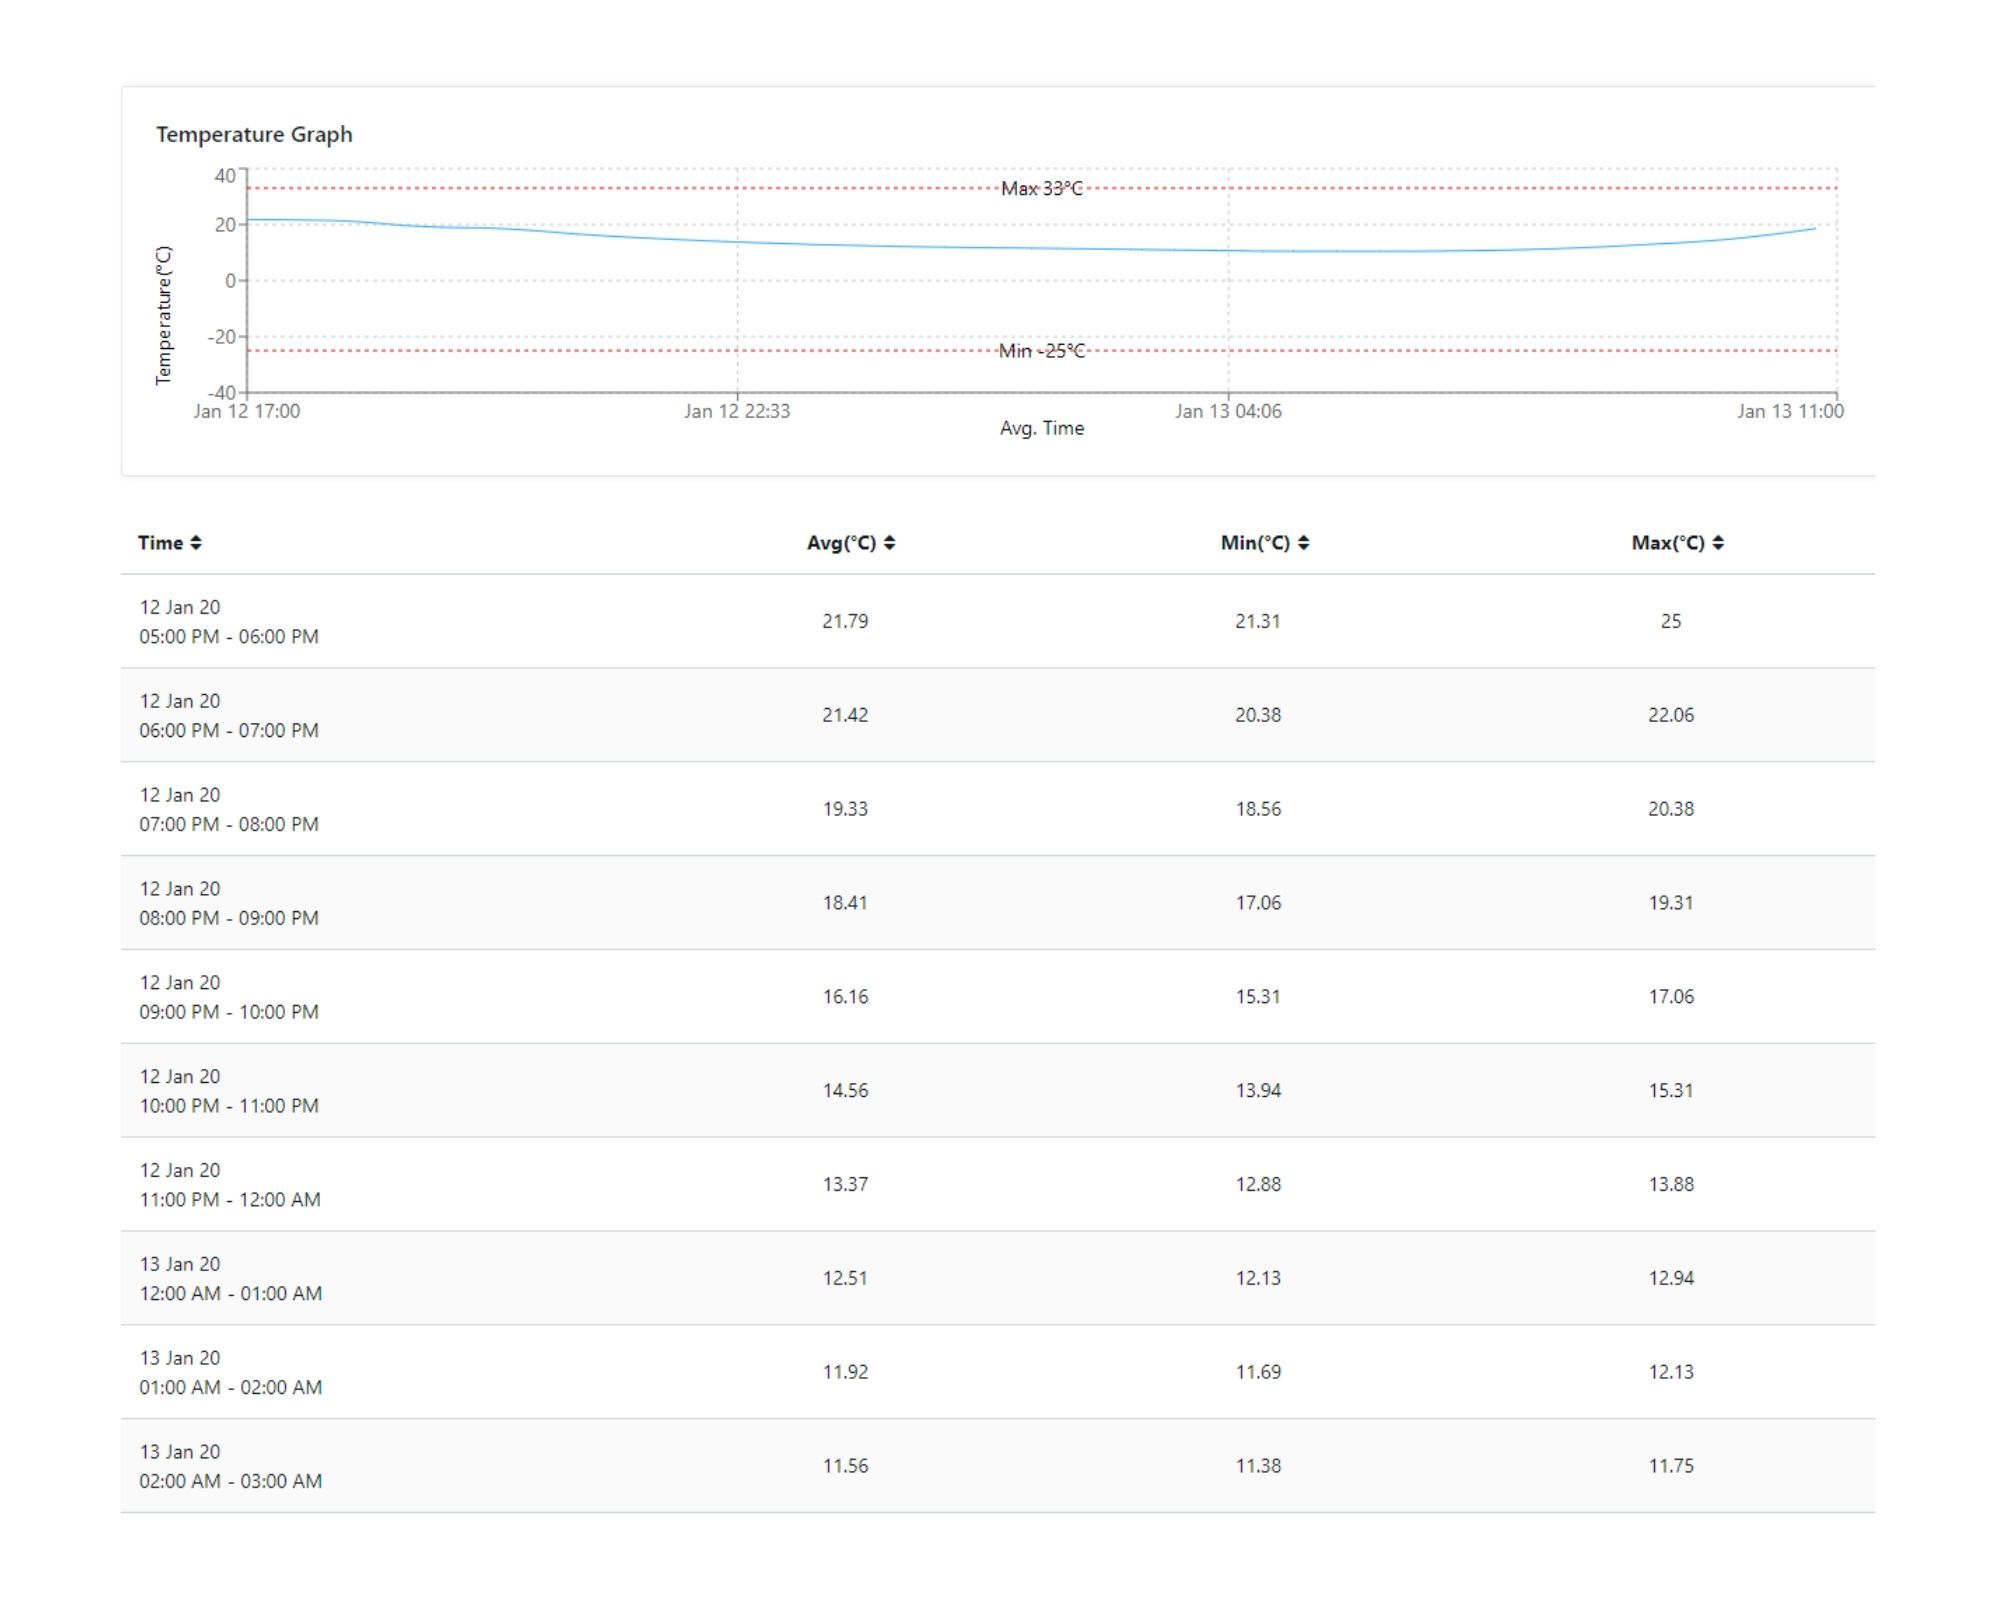
- Temperature Report
If you have a temperature-sensitive cargo, temperature monitoring is indispensable to keep the product integrity intact. Our latest temperature monitoring feature serves this exact need. You get the minute-by-minute picture of how the temperature is changing inside your temperature-sensitive cargo and take safety measures to maintain it.
There are bunch of other reports which we offer and are ready to help you improve your fleet business by getting instant & in-depth insights into your fleet’s performance.
Key Takeaways
- Fleet dashboards simplify complex logistics data into easy-to-understand graphs, reports, and real-time insights.
- Real-time alerts help fleet managers instantly respond to critical events like overspeeding, fuel drops, idling, and geofence violations.
- Data visualization improves decision-making by giving transport businesses a clear picture of fleet performance and operational efficiency.
- Fleet reports help identify hidden inefficiencies such as excessive idling, poor mileage, route deviations, and unsafe driving behavior.
- Fuel consumption reports enable businesses to reduce fuel costs and improve vehicle utilization with actionable insights.
- Temperature monitoring helps cold chain operators maintain cargo safety and ensure product quality during transit.
- Downloadable and customizable reports make it easier to analyze historical fleet performance and improve planning.
- AI-powered fleet management systems like Fleetx improve fleet productivity, driver safety, and logistics visibility through real-time monitoring and analytics.
FAQs – Fleet Reports, Alerts, and Dashboard
What is a fleet management dashboard?
How do real-time alerts help in fleet management?
What are the most important fleet management reports?
How can fleet reports improve vehicle performance?
Why is fuel consumption monitoring important for logistics companies?
What is a geofence alert in vehicle tracking systems?
How does temperature monitoring benefit cold chain transportation?
How does Fleetx help improve fleet productivity?
